in caricamento ...
Weekly Eurozone Overview & Market Summary
Scritto il 27 Gennaio 2013 alle 14:15 da

Key Data Points e spread Bund BTP. Una panoramica su tutti i mercati e sulle varie asset class
Tutto il mercato in una serie di grafici e di dati aggiornati alla chiusura di venerdì sera. Cliccando sui vari links troverete dati sempre aggiornati sui mercati, oltre che grafici ed analisi varie. Un compendio validissimo per l’investitore ed il trader.
Buona visione a tutti.
Weekly Eurozone Overview
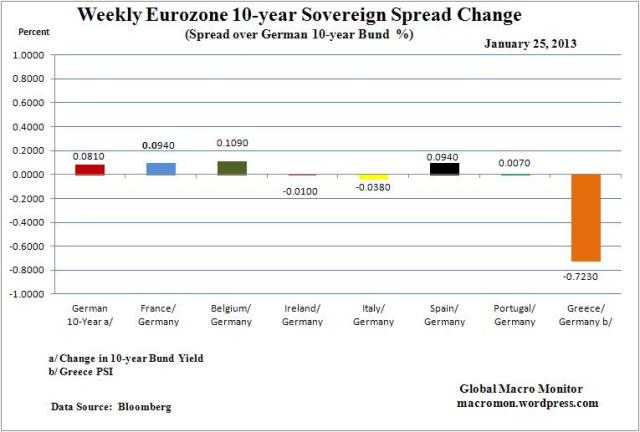
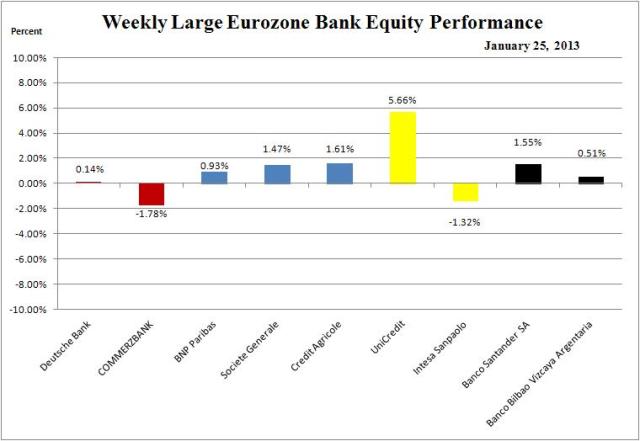

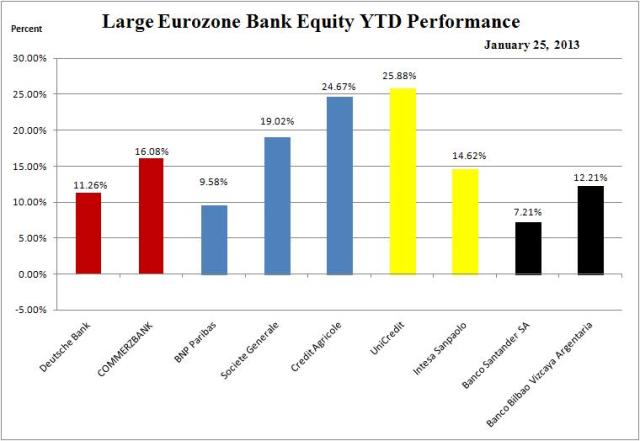


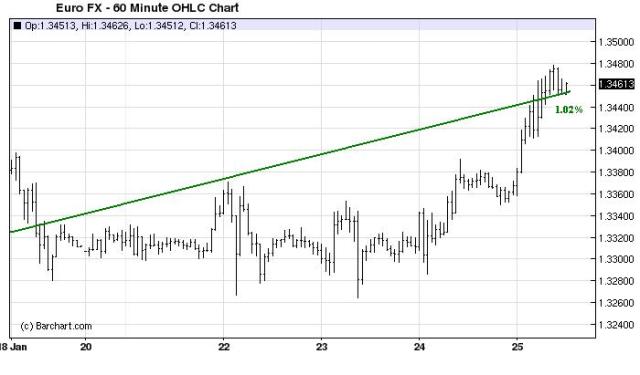
Market Summary
| Major Markets | Close | Change | % Chg | Date | ||
|---|---|---|---|---|---|---|
   $INDU $INDU |
Dow Industrials | 13895.98 | +70.65 | +0.51 | 2013-01-25, 16:00 | |
| $COMPQ |
Nasdaq Composite | 3149.71 | +19.33 | +0.62 | 2013-01-25, 16:00 | |
| $NYA |
NYSE Composite | 8904.52 | +47.94 | +0.54 | 2013-01-25, 16:00 | |
| $SPX |
S&P 500 Large Caps | 1502.96 | +8.14 | +0.54 | 2013-01-25, 16:00 | |
| $XAX |
AMEX Composite | 2412.93 | +4.11 | +0.17 | 2013-01-25, 16:00 | |
| $TSX |
TSX Composite | 12816.03 | -7.59 | -0.06 | 2013-01-25, 16:00 | |
| $CDNX |
Venture Composite | 1227.26 | -2.20 | -0.18 | 2013-01-25, 16:00 | |
| Major Indexes | Close | Change | % Chg | Date | ||
|---|---|---|---|---|---|---|
| $DJA |
Dow Composite | 4752.02 | +21.19 | +0.45 | 2013-01-25, 16:00 | |
| $TRAN |
Dow Transports | 5870.05 | +15.11 | +0.26 | 2013-01-25, 16:00 | |
| $UTIL |
Dow Utilities | 470.05 | +2.78 | +0.59 | 2013-01-25, 16:00 | |
| $NDX |
Nasdaq 100 | 2736.73 | +13.20 | +0.48 | 2013-01-25, 16:00 | |
| $RUI |
Russell 1000 | 834.60 | +4.92 | +0.59 | 2013-01-25, 16:00 | |
| $RUT |
Russell 2000 | 905.24 | +5.05 | +0.56 | 2013-01-25, 16:00 | |
| $RUA |
Russell 3000 | 894.86 | +5.25 | +0.59 | 2013-01-25, 16:00 | |
| $OEX |
S&P 100 | 677.15 | +3.18 | +0.47 | 2013-01-25, 16:00 | |
| $MID |
S&P 400 Mid Caps | 1096.70 | +9.64 | +0.89 | 2013-01-25, 16:00 | |
| $SML |
S&P 600 Small Caps | 508.47 | +2.57 | +0.51 | 2013-01-25, 16:00 | |
| $WLSH |
Wilshire 5000 | 15878.72 | +93.39 | +0.59 | 2013-01-25, 16:00 | |
| AMEX Select Sector SPDRs | Close | Change | % Chg | Date | ||
|---|---|---|---|---|---|---|
| XLY |
Consumer Discretionary ETF | 50.90 | +0.53 | +1.05 | 2013-01-25, 16:00 | |
| XLP |
Consumer Staples ETF | 36.76 | +0.18 | +0.49 | 2013-01-25, 16:00 | |
| XLE |
Energy ETF | 76.89 | +0.72 | +0.95 | 2013-01-25, 16:00 | |
| XLF |
Financial ETF | 17.47 | +0.08 | +0.46 | 2013-01-25, 16:00 | |
| XLV |
Health Care ETF | 42.85 | +0.33 | +0.78 | 2013-01-25, 16:00 | |
| XLI |
Industrial ETF | 40.47 | +0.13 | +0.32 | 2013-01-25, 16:00 | |
| XLB |
Materials ETF | 39.76 | +0.14 | +0.35 | 2013-01-25, 16:00 | |
| XLK |
Technology ETF | 29.30 | +0.03 | +0.10 | 2013-01-25, 16:00 | |
| XLU |
Utilities ETF | 36.23 | +0.18 | +0.50 | 2013-01-25, 16:00 | |
| US Industry Indexes | Close | Change | % Chg | Date | ||
|---|---|---|---|---|---|---|
| $XAL |
Airlines | 50.22 | +0.43 | +0.85 | 2013-01-25, 16:00 | |
| $BKX |
Banks | 54.12 | +0.17 | +0.32 | 2013-01-25, 16:00 | |
| $BTK |
Biotechs | 1680.12 | +20.22 | +1.22 | 2013-01-25, 16:00 | |
| $XBD |
Broker Dealers | 102.15 | +0.91 | +0.90 | 2013-01-25, 16:00 | |
| $DJUSCH |
Chemicals | 414.74 | +3.02 | +0.73 | 2013-01-25, 16:00 | |
| $CRX |
Commodities | 889.07 | +2.64 | +0.30 | 2013-01-25, 16:00 | |
| $XCI |
Comp. Tech | 1077.79 | -0.03 | -0.00 | 2013-01-25, 16:00 | |
| $DDX |
Disk Drives | 107.80 | +3.49 | +3.35 | 2013-01-25, 16:00 | |
| $DRG |
Drugs | 394.30 | +2.84 | +0.73 | 2013-01-25, 16:00 | |
| $XAU |
Gold | 150.82 | -3.96 | -2.56 | 2013-01-25, 16:00 | |
| $HWI |
Hardware | 367.12 | +0.81 | +0.22 | 2013-01-25, 16:00 | |
| $RXP |
Health Care Products | 2262.71 | +13.49 | +0.60 | 2013-01-25, 16:00 | |
| $RXH |
Hospitals | 848.71 | +6.02 | +0.71 | 2013-01-25, 16:00 | |
| $INSR |
Insurance | 5133.13 | +3.63 | +0.07 | 2013-01-25, 16:00 | |
| $IIX |
Internet | 360.19 | +7.25 | +2.05 | 2013-01-25, 16:00 | |
| $XNG |
Natural Gas | 689.08 | +5.42 | +0.79 | 2013-01-25, 16:00 | |
| $NWX |
Network | 247.76 | +3.31 | +1.36 | 2013-01-25, 16:00 | |
| $XOI |
Oil | 1330.22 | +10.34 | +0.78 | 2013-01-25, 16:00 | |
| $OSX |
Oil Services | 245.00 | +3.42 | +1.42 | 2013-01-25, 16:00 | |
| $DJUSPP |
Paper | 142.44 | +0.27 | +0.19 | 2013-01-25, 16:00 | |
| $DJR |
REITs | 280.93 | +1.34 | +0.48 | 2013-01-25, 16:00 | |
| XRT |
Retailers | 67.13 | +0.94 | +1.42 | 2013-01-25, 16:00 | |
| $SOX |
Semis | 415.44 | +5.20 | +1.27 | 2013-01-25, 16:00 | |
| $XTC |
Telecoms | 1083.29 | -2.12 | -0.19 | 2013-01-25, 16:00 | |
| $TRANQ |
Transport | 2538.40 | +7.76 | +0.31 | 2013-01-25, 16:00 | |
| $UTY |
Utilities | 475.36 | +2.97 | +0.63 | 2013-01-25, 16:00 | |
| International ETFs | Close | Change | % Chg | Date | ||
|---|---|---|---|---|---|---|
| EFA |
EAFE Index ETF | 59.03 | +0.63 | +1.08 | 2013-01-25, 16:00 | |
| EEM |
MSCI Emerging Markets ETF | 44.16 | -0.15 | -0.34 | 2013-01-25, 16:00 | |
| EWA |
Australia ETF | 25.99 | +0.09 | +0.35 | 2013-01-25, 16:00 | |
| EWO |
Austria ETF | 18.70 | +0.30 | +1.63 | 2013-01-25, 16:00 | |
| EWK |
Belgium ETF | 14.57 | +0.24 | +1.67 | 2013-01-25, 16:00 | |
| EWZ |
Brazil ETF | 56.77 | +0.07 | +0.12 | 2013-01-25, 16:00 | |
| EWC |
Canada ETF | 28.98 | -0.10 | -0.34 | 2013-01-25, 16:00 | |
| FXI |
China ETF | 41.10 | -0.43 | -1.04 | 2013-01-25, 16:00 | |
| EWQ |
France ETF | 24.58 | +0.48 | +1.99 | 2013-01-25, 16:00 | |
| EWG |
Germany ETF | 25.80 | +0.58 | +2.30 | 2013-01-25, 16:00 | |
| EWH |
Hong Kong ETF | 20.31 | +0.02 | +0.10 | 2013-01-25, 16:00 | |
| INP |
India ETF | 61.62 | +0.41 | +0.67 | 2013-01-25, 16:00 | |
| EWI |
Italy ETF | 14.57 | +0.20 | +1.39 | 2013-01-25, 16:00 | |
| EWJ |
Japan ETF | 9.87 | +0.07 | +0.71 | 2013-01-25, 16:00 | |
| EWM |
Malaysia ETF | 14.73 | +0.01 | +0.07 | 2013-01-25, 16:00 | |
| EWW |
Mexico ETF | 74.18 | -0.13 | -0.17 | 2013-01-25, 16:00 | |
| EWN |
Netherlands ETF | 21.63 | +0.37 | +1.74 | 2013-01-25, 16:00 | |
| RSX |
Russia ETF | 30.95 | +0.47 | +1.54 | 2013-01-25, 16:00 | |
| EWS |
Singapore ETF | 13.67 | -0.05 | -0.36 | 2013-01-25, 16:00 | |
| EWY |
South Korea ETF | 59.78 | -1.21 | -1.98 | 2013-01-25, 16:00 | |
| EWP |
Spain ETF | 32.93 | +0.64 | +1.98 | 2013-01-25, 16:00 | |
| EWD |
Sweden ETF | 31.48 | +0.58 | +1.88 | 2013-01-25, 16:00 | |
| EWL |
Switzerland ETF | 28.57 | +0.16 | +0.56 | 2013-01-25, 16:00 | |
| EWT |
Taiwan ETF | 13.24 | -0.07 | -0.53 | 2013-01-25, 16:00 | |
| EWU |
United Kingdom ETF | 18.45 | +0.17 | +0.93 | 2013-01-25, 16:00 | |
| US Bonds | Close | Change | % Chg | Date | ||
|---|---|---|---|---|---|---|
| $TYX |
30 Year T-Bond Yield | 31.33 | +0.94 | +3.09 | 2013-01-25, 15:00 | |
| $TNX |
10 Year T-Note Yield | 19.47 | +1.03 | +5.59 | 2013-01-25, 15:00 | |
| $FVX |
5 Year T-Note Yield | 8.47 | +0.87 | +11.45 | 2013-01-25, 15:00 | |
| $IRX |
Short-Term Yields | 0.70 | -0.05 | -6.67 | 2013-01-25, 16:00 | |
| US Commodities | Close | Change | % Chg | Date | ||
|---|---|---|---|---|---|---|
| GLD |
Gold ETF | 160.65 | -0.77 | -0.48 | 2013-01-25, 16:00 | |
| SLV |
Silver ETF | 30.21 | -0.44 | -1.44 | 2013-01-25, 16:00 | |
| PPLT |
Platinum ETF | 166.55 | +1.29 | +0.78 | 2013-01-25, 16:00 | |
| PALL |
Palladium ETF | 72.65 | +1.39 | +1.95 | 2013-01-25, 16:00 | |
| CU |
Copper ETF | 30.78 | -0.14 | -0.47 | 2013-01-25, 16:00 | |
| USO |
Light Crude Oil ETF | 34.78 | +0.02 | +0.06 | 2013-01-25, 16:00 | |
| UGA |
Gasoline ETF | 60.78 | +0.35 | +0.57 | 2013-01-25, 16:00 | |
| UNG |
Natural Gas ETF | 19.52 | -0.01 | -0.05 | 2013-01-25, 16:00 | |
| UHN |
Heating Oil ETF | 34.05 | -0.25 | -0.74 | 2013-01-25, 16:00 | |
| CORN |
Corn ETF | 44.42 | -0.26 | -0.58 | 2013-01-25, 16:00 | |
| SGG |
Sugar ETF | 65.93 | -0.64 | -0.96 | 2013-01-25, 16:00 | |
| JO |
Coffee ETF | 33.27 | +0.20 | +0.60 | 2013-01-25, 16:00 | |
| DBC |
DB Commodities Tracking ETF | 28.01 | -0.06 | -0.21 | 2013-01-25, 16:00 | |
| DBA |
DB Agriculture ETF | 27.58 | -0.04 | -0.14 | 2013-01-25, 16:00 | |
| DBE |
DB Energy ETF | 28.80 | -0.04 | -0.14 | 2013-01-25, 16:00 | |
| DBB |
DB Industrial Metals ETF | 18.98 | -0.15 | -0.78 | 2013-01-25, 16:00 | |
| COW |
Dow Jones-UBS Livestock ETF | 27.74 | -0.08 | -0.29 | 2013-01-25, 16:00 | |
| DBP |
DB Precious Metal ETF | 56.93 | -0.41 | -0.72 | 2013-01-25, 16:00 | |
| Currencies | Close | Change | % Chg | Date | ||
|---|---|---|---|---|---|---|
| UUP |
US Dollar ETF | 21.78 | -0.05 | -0.23 | 2013-01-25, 16:00 | |
| $XAD |
Australian Dollar | 104.16 | -0.52 | -0.50 | 2013-01-25, 16:00 | |
| $XBP |
British Pound | 158.04 | +0.14 | +0.09 | 2013-01-25, 16:00 | |
| $CDW |
Canadian Dollar | 99.44 | -0.34 | -0.34 | 2013-01-25, 16:00 | |
| $XEU |
Euro Index | 134.60 | +0.85 | +0.64 | 2013-01-25, 16:00 | |
| $XJY |
Japanese Yen | 110.09 | -0.65 | -0.59 | 2013-01-25, 16:00 | |
| FXS |
Swedish Krona | 153.80 | +0.46 | +0.30 | 2013-01-25, 16:00 | |
| $XSF |
Swiss Franc | 107.95 | +0.28 | +0.26 | 2013-01-25, 16:00 | |
| Market Breadth | Close | Change | % Chg | Date | ||
|---|---|---|---|---|---|---|
| $VIX |
Volatility Index | 12.89 | +0.20 | +1.58 | 2013-01-25, 16:00 | |
| $TICK |
NYSE Tick | 823.00 | +138.00 | +20.15 | 2013-01-25, 16:00 | |
| $TICKQ |
Nasdaq Tick | 547.00 | +157.00 | +40.26 | 2013-01-25, 16:00 | |
| $TRIN |
NYSE Trin | 0.60 | -0.35 | -36.84 | 2013-01-25, 16:00 | |
| $TRINQ |
Nasdaq Trin | 0.52 | -0.50 | -49.02 | 2013-01-25, 16:00 | |
| $NYMO |
NYSE McClellan Oscillator | 35.15 | +2.31 | +7.03 | 2013-01-25, 16:00 | |
| $NAMO |
Nasdaq McClellan Oscillator | 15.96 | +1.67 | +11.69 | 2013-01-25, 16:00 | |
Sostieni I&M. il tuo contributo è fondamentale per la continuazione di questo progetto!
![]()
STAY TUNED!
DT
Non sai come comportarti coi tuoi investimenti? BUTTA UN OCCHIO QUI| e seguici su TWITTER per non perdere nemmeno un flash real time! Tutti i diritti riservati © | Grafici e dati elaborati da Intermarket&more su databases professionali e news tratte dalla rete | NB: Attenzione! Leggi il disclaimer (a scanso di equivoci!)
Nessun commento Commenta