USA: ci avviciniamo alla saturazione

Guardate questi tre grafici.
1) Rapporto tra andamento degli UTILI societari USA e i nuovi posti di lavoro USA.

(…) The number of job openings in the U.S. fell to a two-year low in December, reflecting a slowdown in hiring tied to a softening economy.
Although job opening are still relatively high and hiring is steady, economists say the sharp drop toward the end of 2019 is a bit worrisome.Job openings sank to 6.42 million in December from 6.79 million, the Labor Department said Tuesday. It’s the second significant decline in a row and openings have fallen by more than 1 million in the past 12 months. (…) [Source]
2) Delinquency rate: e l’Auto decolla
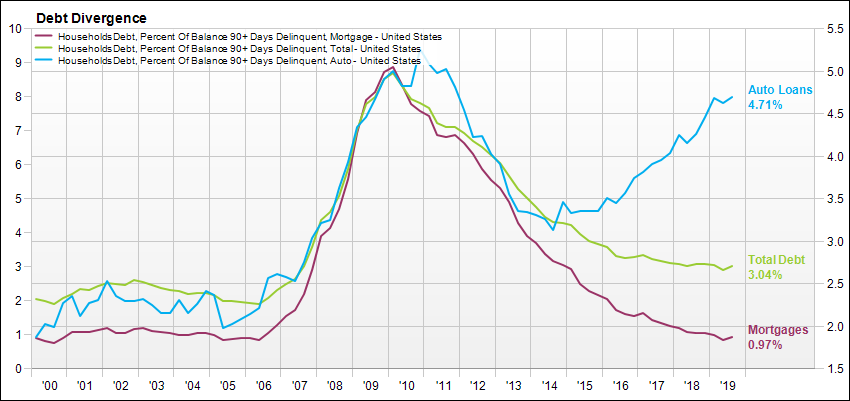
(Reuters) – American households added $193 billion of debt in the fourth quarter, driven by a surge in mortgage loans, and overall debt levels rose to a new record at $14.15 trillion, the Federal Reserve Bank of New York said on Tuesday. Mortgage balances rose by $120 billion in the fourth quarter to $9.56 trillion, the New York Fed said in its quarterly report on household debt. Mortgage originations – pushed up by an increase in refinancing – also rose to $752 billion in the fourth quarter, reaching the highest volume since the fourth quarter of 2005, the report found. Non-housing debt, including auto loans, credit cards and student loans, rose by $79 billion.
3) PREMIO dell’equity USA

Sommate i tre grafici, troverete probabilmente un mondo, quello economico USA, che inizia ad essere stanco e dopo tanti anni di sovra performance, rischia di segnare il passo. O quantomeno di sottoperformare rispetto agli altri mercati. E mi fermo qui, perché il momento è fortemente condizionato dai fattori esogeni.
4) US HouseHold Debt
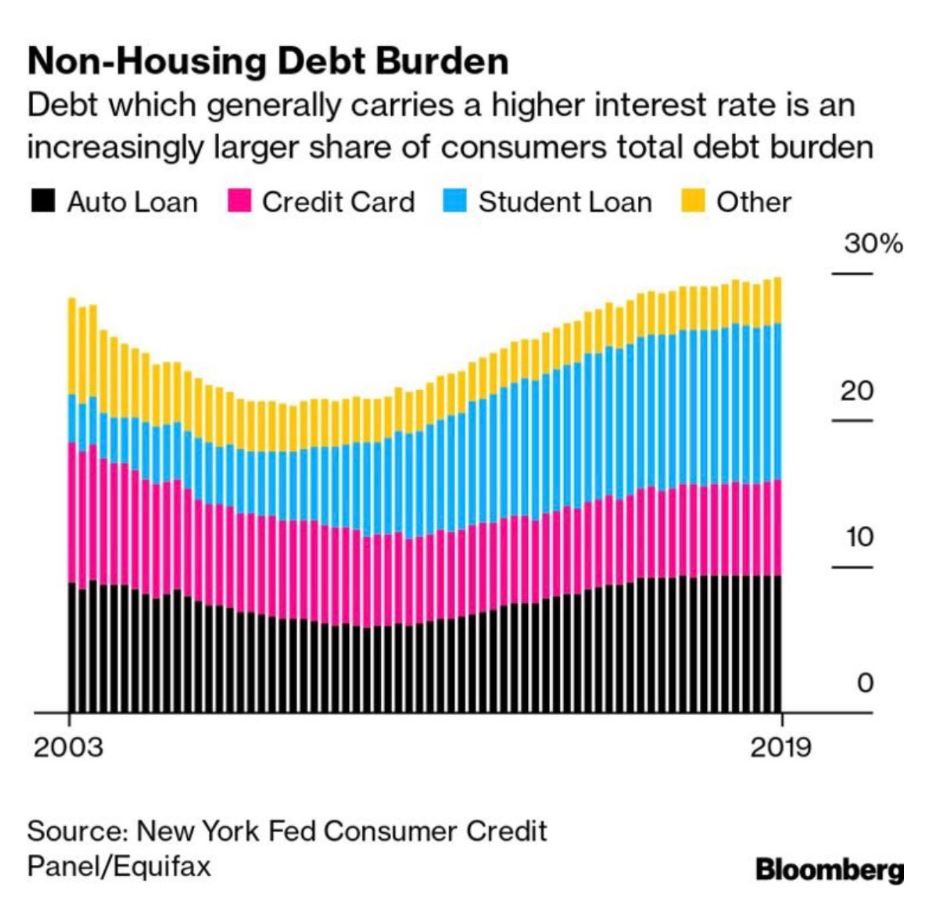
Per chiudere il cerchio è giusta sapere che il debito privato USA ha raggiunto picchi mai visti . 14 trillioni di USD, E quali sono le due voci che dominano su tutte? Auto Loans e Student Loans. Associate il tutto al grafico in area 2) e forse capirete che è proprio tutto rose e fiori.
Total U.S. household debt rose by $601 billion in the fourth quarter from a year earlier, or 4.4%, surpassing $14 trillion for the first time, the New York Fed’s quarterly household credit and debt report showed. That’s $1.5 trillion above the previous peak in the third quarter of 2008. Overall household debt is now 26.8% above the second-quarter 2013 trough. [Source]

STAY TUNED!
–