in caricamento ...
Stime utili S&P 500: ma i conti non tornano
Scritto il 11 Settembre 2009 alle 12:30 da

La ripresa economica ha fatto si che molti analisti tornassero a considerare la redditività delle aziende quotate in borsa e quindi, facendo dei calcoli, sono state riconsiderate le stime di utili per lo SP 500 , il listino azionario benchmark a livello globale.
Ma non solo sugli USA ma anche sull’Europa.
Per esempio UBS ha recentemente alzatole stime, portando l’aumento dell’Eps (earning per share) a +25% rispetto l’anno precedente per il Vecchio Continente.
Cosa simile ha fatto la nostra vecchia conoscenza Goldman Sachs, la quale addirittura esagera e porta le stime degli Eps a +40%. Gran bei numeri….
Quindi tra le varie case d’affari protagoniste in queste revisioni, troviamo nomi di primissimo piano e non banchettedi secondo livello. Nomi che contano o che vogliono , in modo compatto, portare alla popolazione mondiale un “credo” condiviso che vada ad influenzare il comportamento del risparmiatore (non so se mi sono spiegato…).
Ma veniamo al nocciolo della questione.
Stime degli utili dello SP 500
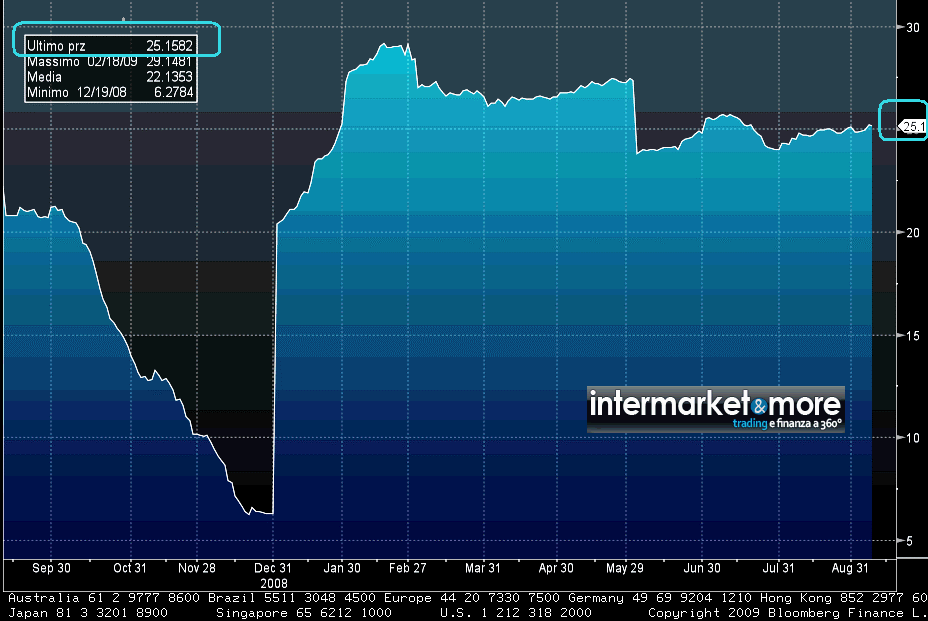
Questo grafico qui sopra è una piccola chicca. Rappresenta il grafico delle stime di crescita degli Epsper il mercato USA, in particolar modo per lo SP 500.
Come vedete le stime, ad oggi, sono per un incremento degli utili per il 2010 pari a +25,16%.
Un balzo quantitativo non indifferente. Questa stima è stata calcolata prendendo in considerazione il parere di 1500 analisti contattati dall’agenzia americana Bloomberg. Si tratta di una delle crescite più notevoli di utili mai registrate, dato che è accompagnato dal “giustificato” rialzo del 50% dei mercati finanziari, fatto registrare nelle ultime settimane/mesi.
Previsione crescita PIL USA

Ma ora andiamo a vedere un altro dato, ovvero quali sono le previsioni per la crescita del PIL USA. La tabella qui sopra illustra in modo inequivocabile quali sono le previsioni degli analisti in merito a questi dati sulla crescita del PIL.
Per il 2009 (per la cronaca) le previsioni sono per un-2.60 ma per il 2010 (Dato che ci interessa per questa analisi) il PIL crescerà del +2.30%.
Ma giunti a questo punto i conti non tornano.
E’ possibile ottenere un aumento degli utili pari al 25%, con un incremento del PIL pari “solo” al 2.30%?
Se andiamo a fare un’analisi storica, condotta dall’amico anonimocds (per la cronaca) che mi fornisce il dato, per ottenere una crescita degli Eps pari al 25%, occorre trovarsi con un PIL USA decisamente virtuoso, pari ad un 4.1%.
Ma attenzione, il PIL in aumento per il 2010 a +2.30% è un datoche oggi suona decisamente in chiave ottimistica, in quanto non mancano le stime più prudenti a 1.5%, 1.20% e persino 0.5% per i più pessimisti (vedi il grafico rosso).
Quindi qui qualcuno sta sbagliando i conti. Ma chi si sbaglia? Gli analisti o gli economisti? Il problema però non sta nello sbagliare, ma sulla quantità dell’errore. Infatti l’errore potrebbe erre pari a circa il 50% della stima. Vi sembra poco?
I 5 punti di Rosenberg
Chiudo questo post, che probabilmente farà storcere il naso a qualcuno e magari metterà nella testa dei lettori quancle dubbio in più, con un elenco.
I 5 punti di David A. Rosenberg. Certo, questo personaggio è uno dei più negativi, però l’ho sempre torvato molto realistico. Ognuno faccia le proprie valutazioni.
1. This remains a hope-based rally (with strong technicals). I say that because during this six-month 50%+ rally in the S&P 500, the U.S. economy has shed 2.4 million jobs, which is almost as many as we lost during the entire 2001-02 tech wreck — in just six months. The market’s ability to shrug off the loss of 2.4 million jobs is either a sign that it is treating this as old news or sees the cost-cutting as good news for profits. Either way, what we are seeing transpire is without precedent — the magnitude of the employment slide versus the magnitude of the market advance. Truly fascinating stuff.
2. Companies have not really been beating their earnings estimates — only the very final estimates heading into the reporting quarter. For example, the consensus view for 3Q EPS at the start of the year was $21.00, last we saw the estimates were down to just over $14.00. But there is a deeply rooted belief that earnings are coming in better than expected. This is a psychology that is difficult to break. It is completely unknown (for some reason) that corporate revenues are running at a -25% YoY rate, which compares to the -10% we saw at the worst part of the 2001-02 bear market and the -3% trend at the most negative point in 1991.
3. Valuation is a poor timing device but even on “normalized” trailing 10-year earnings, the S&P 500 is trading near 18x, which is now above the historical average of 16x.
4. All the growth we are seeing globally this year is due to fiscal stimulus; not just here in Canada and the U.S., but also in Korea, China, the U.K., and Continental Europe too. For 2010, the government’s share of global growth, by our estimates, will be 80%. In other words, there are still very few signs that organic private sector activity is stirring. For a Keynesian, government stimulus is necessary, but the question for an investor is the multiple one attaches to a global economy that is still relying on a defibrillator. The problem is that governments do not create income or wealth, and today’s stimulus is really a future tax liability. Curiously, that future tax liability is likely going to pose a roadblock for the return to a “normalized” $80 operating EPS estimate that strategists are now starting to pen in for 2011.
5. While Mr. Market may be pricing in a fine future for the U.S., but when the 3-month Treasury-bill yield is 13bps north of zero, which is completely abnormal, you know that there are still substantial fundamental imbalances that need to be worked through.
Buona meditazione a tutti….
STAY TUNED!

ATTENZIONE: nota importante. Sostieni questo BLOG con una donazione, cliccando sul bottone nella colonna di destra. Così facendo, sosterrai questa iniziativa e permetterai al blog di sopravvivere.
Grafici by Bloomberg. Per ingrandirli basta cliccarci sopra.
Nessun commento Commenta