in caricamento ...
I misteri gaudiosi della disoccupazione USA
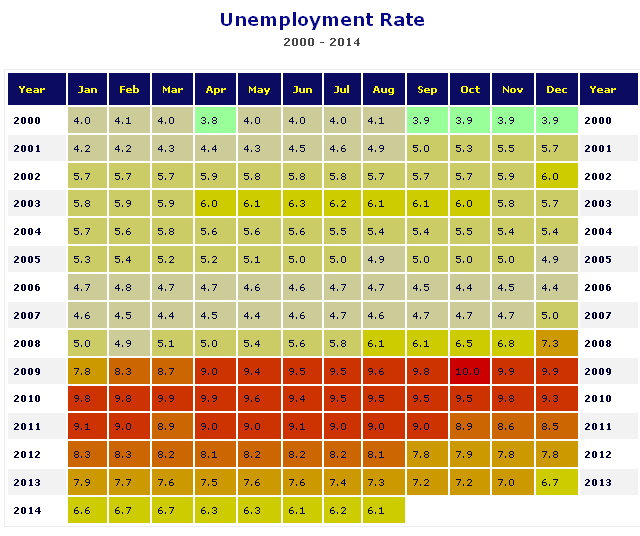
Quando si parla della disoccupazione USA ci sono sempre dati molto contrastanti. Gli ultimi dati usciti hanno confermato le attese, con un tasso disoccupazione nel mese di agosto al 6,1% contro il 6,2% del mese precedente. Sotto le attese, il saldo delle buste paga nei settori non agricoli (non farm payrolls) a +142.000 unità, nettamente peggio delle +230.000 unità stimate dagli analisti.
Ma quindi… come stanno realmente le cose?
Per fare un po’di chiarezza vi pubblico qualche grafico.
La mappa del lavoro USA
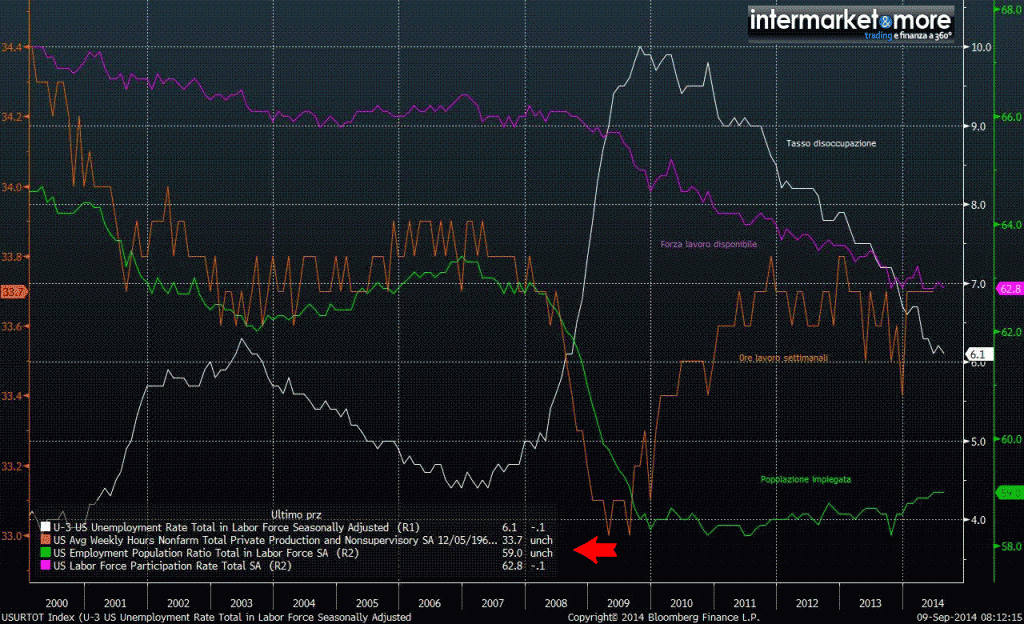
Qui trovate il tasso disoccupazione ufficiale (U-3) paragonato alla forza lavoro disponibile (che sta calando ma questo il grafico della disoccupazione NON ce lo dice) le ore di lavoro pro capite settimanali ed anche la percentuale di popolazione effettivamente impiegata.
Differenza tra U-3 e U-6
Riprendo quanto scritto in QUESTO POST:
U1: Percentuale della forza lavoro disoccupati da almeno 15 settimane
U2: Percentuale di coloro che (U1) che hanno perso il lavoro o ha terminato il lavoro temporaneo.
U3: Tasso di disoccupazione UFFICIALE: coloro che sono senza lavoro (U2) e che hanno attivamente cercato lavoro . nelle ultime quattro settimane
U4: U3 + ” lavoratori scoraggiati “, ovvero coloro che hanno smesso di cercare lavoro perché le attuali condizioni economiche gli fanno pensare che è inutile trovare lavoro e nessun impiego sarebbe disponibile
U5: U4 + altri “lavoratori marginali”, o quelli che “vorrebbero” e sono in grado di lavorare, ma non hanno cercato lavoro recentemente.
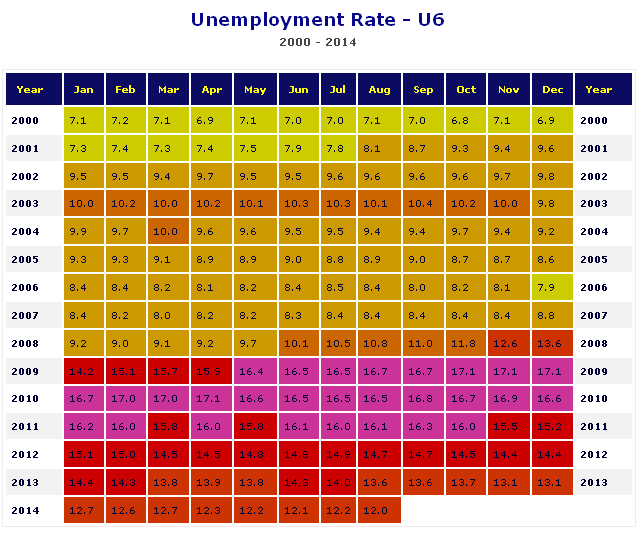
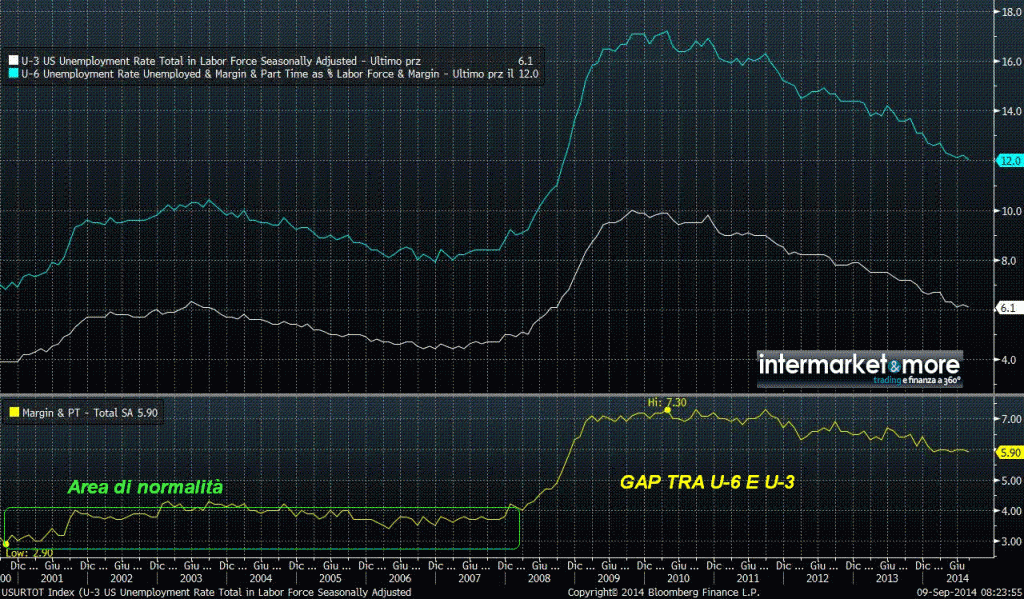
U6: U5 + part-time che vogliono lavorare a tempo pieno, ma che non ci riescono a causa di motivi economici ( sottoccupazione ).
 Vi sembra corretto considerare come tasso disoccupazione il dato U3? O forse sarebbe più corretto analizzare il dato U6?
 Quindi il vero tasso di disoccupazione non è proprio il 6.1% che ci fanno vedere. QUEsto la Yellen lo sa benissimo, ed è il motivo per cui continua a preoccuparsi dei dati del lavoro malgrado il quasi raggiungimento dei target prefissati. Inoltre come illustrato sopra, la partecipazione continua a scendere. Forse la ricetta della FED non ha avuto gli esiti sperati? Forse questa ripresa non ha le basi molto solide? Tutto questo lo scopriremo strada facendo nel momento in cui partirà la exit strategy.
STAY TUNED!
(Clicca qui per ulteriori dettagli)
(Se trovi interessante i contenuti di questo articolo, condividilo ai tuoi amici, clicca sulle icone sottostanti, sosterrai lo sviluppo di I&M!). E se lo sostieni con una donazione, di certo non mi offendo…
I need you! Sostienici!
Segui @intermarketblog
Questo post non è da considerare come un’offerta o una sollecitazione all’acquisto.
Informati presso il tuo consulente di fiducia. Se non ce l’hai o se non ti fidi più di lui,contattami via email (intermarketandmore@gmail.com).
NB: Attenzione! Leggi il disclaimer (a scanso di equivoci!)
sono cose risapute, la stessa Yellen ne parla..
mi domando perché su questi blog non si parli mai del tasso “U6” italiano.. forse perché è il doppio di quello USA ? o semplicemente perché non lo si sa?
negli States ho visto che i ragazzi usciti dal college riescono a trovare TUTTI lavoro nel giro di qualche mese, in Italia la situazione è ben diversa, ho visto scene veramente disperate in Toscana !
è una questione di competitività del costo del lavoro: si preferisce produrre nei paesi dove il costo del lavoro è decisamente inferiore e dove….. fra l’altro le aziende pagano tasse irrisorie.
In 2013, a disproportionate share of unemployed Workers had been employed in four Industries:
-1- leisure and hospitality;
-2- construction;
-3- professional and business services;
-4- wholesale and retail trade.
But, none of the Workers who had been employed in these Industries were more likely than other Workers to have been out of work for two years or more.
In 2013, 9.4% of Persons with jobs worked in the leisure and hospitality Industries, but 14.5% of unemployed Workers had worked in these Industries.
While 12.6% of all unemployed Workers had been out of work for two or more years, Persons who had been employed in the leisure and hospitality Industries were less likely, 10.3%, than other Workers to have been looking for work for two years or more.
Although they were not overrepresented among unemployed Workers in 2013, unemployed Workers who had worked in two Industries—financial activities and manufacturing—were overrepresented among the very long-term unemployed.
An estimated 15.8% of unemployed Workers who had worked in financial activities had been out of work for two years or more.
Similarly, approximately 15.1% of Workers who had been employed in manufacturing had been looking for work for two years or longer.
In 2013, Workers in six broad occupational categories were overrepresented among the unemployed. Among these six occupations, only Workers who had been employed in “office and administrative support” occupations were overrepresented among Workers who had been unemployed for two years or more.
Workers in the following occupations were overrepresented among the unemployed in 2013:
-1- services;
-2- construction and extraction;
-3- transportation and material moving;
-4- production;
-5- sales and related;
-6- office and administrative support.
Although an estimated 12.6% of all unemployed Workers had been out of work for two or more years, approximately 15.1% of unemployed Workers who had worked in office and administrative support occupations had been looking for work for two years or more.
Among unemployed Workers who had worked in service occupations, 11.4% had been looking for work for two or more years, which is less than the average of 12.6% for all unemployed Workers.
In 2013, a majority of unemployed Workers had a high school education or less. But, unemployed Workers with a high school degree only or with a bachelor’s degree or better were equally likely to have been looking for work for two years or more.
Among Persons who had jobs in 2013, 35.8% had a high school education or less.
However, among unemployed Workers, 54% had a high school education or less.
Among unemployed Workers, those with a bachelor’s degree (13.5%) were more likely than those with some college (11.9%) or those with less than a high school education (11.4%) to have been looking for work for two years or more.
However, the percentage of unemployed Workers with a high school education only (12.8%) who had been looking for work for two or more years was not statistically different from the percentage of unemployed Workers with a bachelor’s degree (13.5%) or the percentage with an advanced or professional degree (13.9%) who had been looking for work for two years or longer.
In 2013, a disproportionate share of unemployed Workers had never been married. But, among unemployed Workers, married Workers were more likely than Workers who had never been married to have been unemployed for two years or more.
In 2013, Persons who had never been married accounted for 29.5% of employed Workers, but 50.5% of Workers who were unemployed.
Among unemployed Workers, married Workers were more likely than Workers who had never been married to have been out of work for two years or more (12.9% compared to 10.9%).
Similarly, unemployed Workers who were widowed, divorced, or separated were more likely than Workers who had never been married to have been out of work for two or more years (16.2% compared to 10.9%).
◆ G. Mayer (Congressional Research Service), “The trend in long-term unemployment and characteristics of workers unemployed for two years or more” – CRS report for US Congress: No R41559 ► March 24, 2014 ◄
http://fas.org/sgp/crs/misc/R41559.pdf
-[ ♛ J. M. Whittaker, K. P. Isaacs (Congressional Research Service), “Extending unemployment compensation benefits during recessions” – CRS report for US Congress: No RL34340 ► May 2, 2013 ◄
http://fas.org/sgp/crs/misc/RL34340.pdf ◄ See to pages 8-16 (or 12-20 / 39) ]-
サーファー © Surfer


Complimenti Danilo ottimo articolo.
E’ quello che accennavo anch’io oggi. Una ripresa ( ??? ) in cui però rimane molto alto il tasso di disoccupazione proprio perchè è frutto solo di costituzione di scorte, con domanda scarsa e consumi fiacchi e con deflazione ormai conclamata.