in caricamento ...
WALL STREET: la giusta ricetta per leggere il rally del mercato
 La sola demagogia porta il nulla. I mercati azionari si muovono su dinamiche che sono incentrate alla fine su un unico elemento. Gli utili societari. Anche nel caso dello Sp 500 occorre monitorare con attenzione i price earning e gli utili attesi. Nella fattispecie però…
Rischio rallentamento globale, inversione della tendenza nella politica monetaria della FED, Dollaro troppo forte. Queste sono solo alcune delle motivazioni che preoccupano gli operatori.
Però, malgrado tutto, la borsa USA continua a salire.
Dite che i mercati sono drogati dalla valanga di liquidità che ha generato quella che ho definito (ormai da anni) come una bolla da asset (visto che ha colpito TUTTO tranne le commodities)? Dite bene, è corretto. Però la borsa USA (che, ricordiamolo, è un benchmark a livello mondiale) continua a salire.
Dite che è una crescita poco sana? Vero. Dite che il mercato del lavoro illustra una realtà distorta? Vero. Dite che un inversione dei tassi potrebbe rappresentare un problema? Vero. Dite che la fine del QE potrebbe far mancare all’economia quel “plus” che le ha permesso di crescere in modo importante? Vero. Però come detto la borsa Usa continua a salire.
Cari amici, LO VOGLIO METTERE IN CHIARO UNA VOLTA PER TUTTE. Noi qui cerchiamo di creare CONSAPEVOLEZZA, sapendo che prima o poi questo mercato, che poggia le basi sulla sabbia, pagherà pegno. Ma una cosa è la macroeconomia, l’economia reale e tutto quanto ne deriva. Un’altra cosa sono i mercati finanziari.
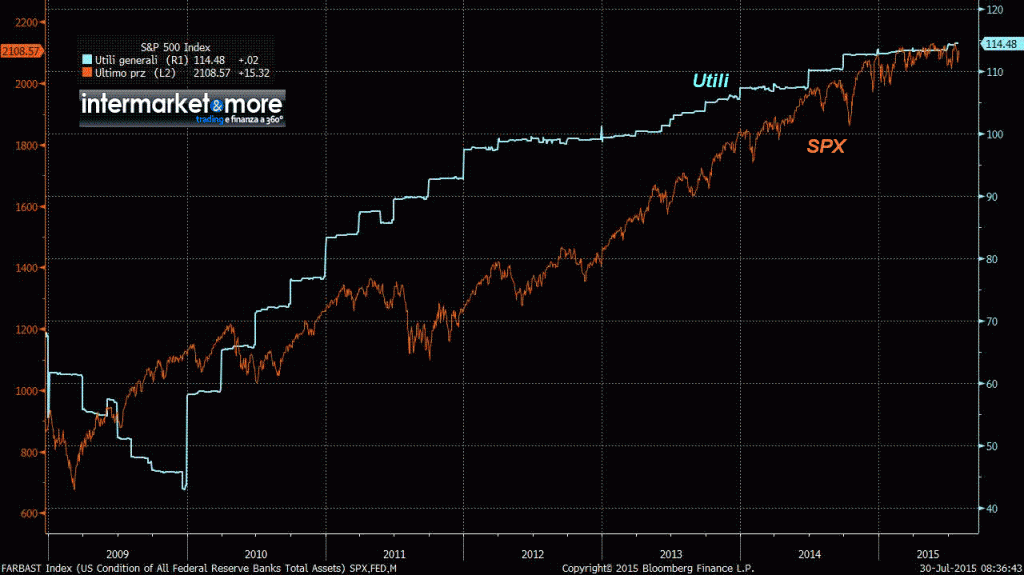
E’ profondamente sbagliato dire che il QE ha alimentato il rally di borsa. Il QE ha contribuito ad alimentare in modo decisivo la crescita economica e quindi, indirettamente, i consumi ed i profitti delle aziende. Ed è proprio qui la chiave di tutto. La borsa USA sale NON eprchè lo ha deciso la FED ma perché in un modo o nell’altro, gli utili aziendali sono mediamente saliti e non di poco.
Confronto tra utili SP 500 e borsa
 Alla fine, è questo e solo questo il grafico che interessa al mercato. La crescita degli utili e fintanto che questa crescita continua, sarà difficile (tranne nel caso di vedere shock sistemici) assistere a grossi crolli di mercato.
Voi mi direte: ok, questa è la fotografia del mercato allo stato attuale ma è palese che il mercato tende ad “anticipare” il futuro. Quindi occorre guardare avanti.
Ragionamento corretto. La cosa che infatti occorre valutare è un’altra. Il grafico prima presentato mette in luce il legame fortissimo e fondamentale tra utili societari e trend di borsa (ed in modo lato è anche importante il trend dei tassi di interesse e il rapporto con il dividend yield). Ma per capire se la borsa continuerà con il suo mega rally bisogna guardare avanti. Ed ecco quindi COSA oggi sconta il mercato.
Previsioni utili e non solo per lo SP 500
 Come vedete si scontano utili a due cifre ancora per i prossimi anni (qui 2016-2017). La domanda che occorre prosi è la seguente: ma riusciranno le aziende USA a mantenere realmente questi trend di crescita degli utili? Non dimentichiamo che proprio negli ultimi periodi, sono state fatte anche delle politiche molto invasive a livello societario (buy back, taglio di costi e quant’altro) che hanno alimentato un miglioramento di bilancio non ripetibile. Inoltre se già adesso si scontano certi numeri, cosa bisognerebbe scontare per poter giustificare un ulteriore rally di borsa? Ed infine: un eventuale aumento dei tassi di interesse potrebbe cominciare a far spostare l’interesse di certi operatori (anche se in modo molto limitato all’inizio) dal mercato azionario a quello obbligazionario, soprattutto nel rapporto prima accennato, ovvero tassi di interesse contro Dividend Yield. Quali saranno gli effetti su Wall Street?
Di parole se ne possono fare tante, ma alla fine quello che conta nel mondo dell’azionario, sono gli UTILI SOCIETARI. Tenete bene a mente questi numeri e monitorateli. Sono la miglior chiave di lettura per i mercati azionari americani sopratutto per capirne le dinamiche. poi come detto, il mercato è distorto. Prendiamo atto ma non dobbiamo per forza focalizzarci solo sulla macroeconomia, anceh se guardando questo grafico…
Riproduzione riservata
STAY TUNED!


The popular press often uses the term “bubble” to describe a situation in which the price of an ASSET has increased SIGNIFICANTLY in such a short period of time so as to suggest that the price is SUSCEPTIBLE to an equally sudden COLLAPSE.
After the financial storm that spread from the United States in the summer of 2007 to many “advanced economies” by the fall of 2008, the Economics Profession was criticized
1- for “not being able to predict the crisis”
and
2- for “the Profession’s limited understanding of the mechanisms that generated the upheaval and allowed it to spread”.
Today, there is an abundance of new research that places the crisis in a historical context and links it to the development and bursting of “asset bubbles” – those periods of explosive behavior of prices.
Hopefully, this and future research will help ward off the “this-time-is-different” syndrome (popularized by Economists Carmen Reinhart and Kenneth Rogoff), that’s, the mistaken idea that old rules about taking risks no longer apply once financial innovation and “reforms” occur in financial markets and the economy.
In article [see to _§_, at the end], the Authors of/in the Federal Reserve Bank of St. Louis try to explain the difficulties of defining and anticipating “asset bubbles”, focusing on the two types of assets that attract the lion’s share of Households’ wealth – stocks and real estate.
They discuss the way booms and busts in asset prices relate to financial crises, as well as the difficulties Economists face in identifying bubbles.
They then use a novel statistical technique, developed in the aftermath of the financial crisis, to compare past “asset bubbles” in the U.S..
As studied in the real estate economics literature, the sensitivity of house prices to changes in fundamentals is larger when interest rates are low and in locations where expected price growth is high; so, fast price increases (relative to rent) do not necessarily signal the presence of a bubble even when they appear as “exuberant”.
The correct measure to use, as a comparison for rents, is the imputed annual rental cost of owning a home, a variant of what Economists call the “user cost”, which is particularly difficult to measure.
Similarly, in the stock market, price/earnings are affected by the risk-free rate in the economy, the equity premium and the growth rate of earnings, all of which can change over time and, therefore, can affect the price/dividend ratio independently of the presence of a bubble.
These considerations do not affect the validity of the statistical approach to detect episodes of explosive behavior – an approach that is now available and very helpful for monitoring various markets.
However, these considerations of the models of the Authors warn us to be careful when we interpret the findings that we abstract from an economic model – [Always! SEMPRE!].
l- – – – –
_§_ S. Contessi, U. Kerdnunvong (Federal Reserve Bank of St. Louis, the), “Boom and bust – Asset bubbles: detecting and measuring them are not easy tasks”, The Regional Economist (Publications) – July 2015: Pp. 4-9
https://www.stlouisfed.org/~/media/Publications/Regional%20Economist/2015/July/asset_bubbles.pdf
– – – – -l
サーファー © Surfer